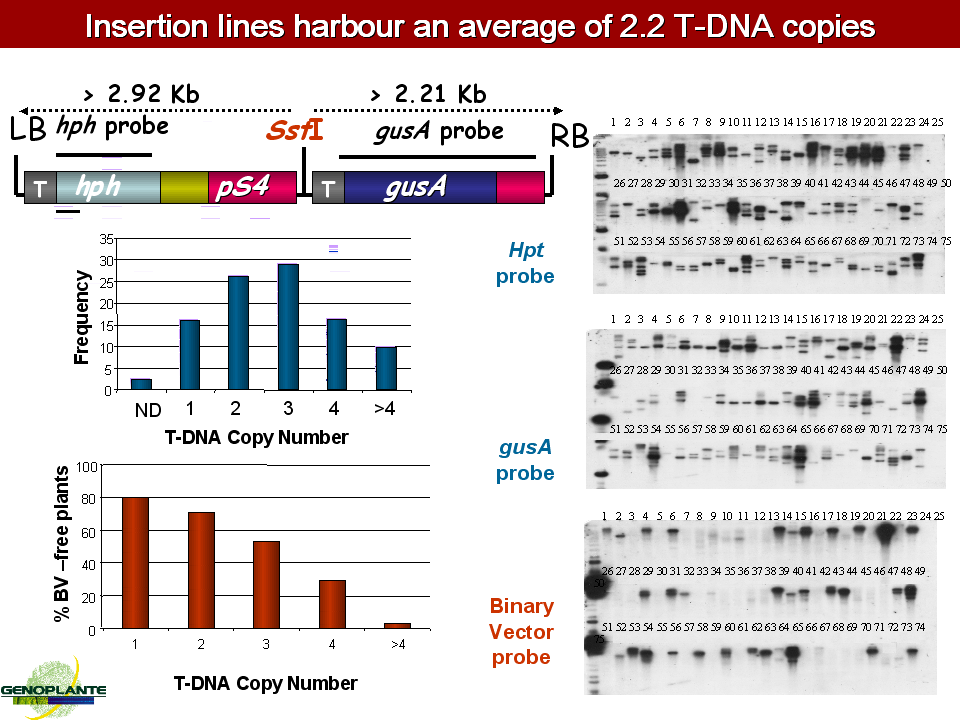
Figure 4: Southern analysis of T-DNA inserts in the Génoplante
library of insertion lines
A: Distribution of the primary
transformants as a function of the number of T-DNA copies integrated (left)
and Southern blot analysis of Sst1 digests of DNA isolated from a set of primary
transformants and hybridized to the hph (upper panel) and gusA (lower panel)
probes (right).
B :Frequency of binary vector-free primary transformants
as a function of the number of T-DNA copies integrated (left) and Southern blot
analysis of Sst1 digests of DNA isolated from a set of primary transformants
and hybridized to the binary vector probe (right). (Rouvière et al. Unpublished)